Microsoft Power BI Data Analyst (PL-300) Free Questions - Part 12
Question No : 166) You use an R visual to produce a map of 500,000 customers. You include the values of CustomerID, Latitude, and Longitude in the fields sent to the visual. Each customer ID is
unique.
In powerbi.com, when users load the visual, they only see some of the customers.
What is the cause of the issue?
A. The visual was built by using a different version of R.
B. The data comes from a Microsoft SQL Server source.
C. The data is deduplicated.
D. Too many records were sent to the visual.
Question No : 167) You are enhancing a Power BI model that has DAX calculations.
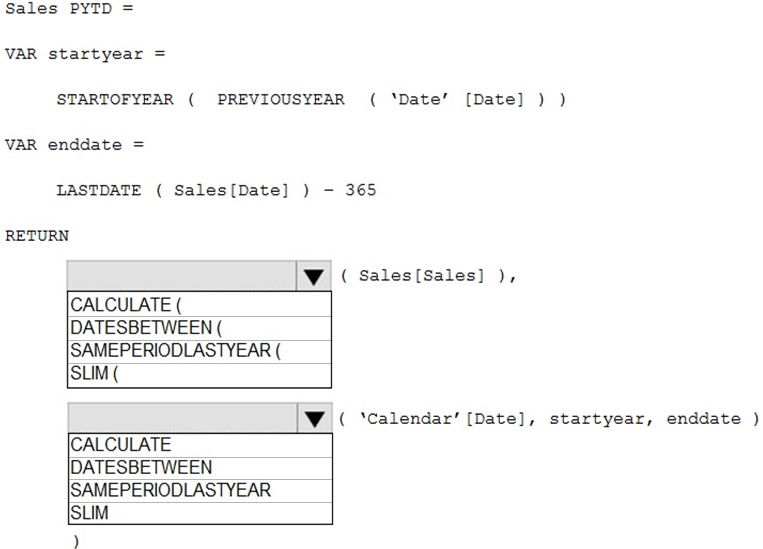
You need to create a measure that returns the year-to-date total sales from the same date of the previous calendar year.
Which DAX functions should you use? To answer, select the appropriate options in the answer area.
NOTE: Each correct selection is worth one point.
Question No : 168) You plan to develop a Power BI report that has a bar chart to display the number of customers by location. You have a table named Customer that has the following columns:
? Customer ID
? CustomerName
? Address
? City
? ProvState
? Country
You need to allow users to drill down by location. The report will display the number of each customer by Country, and drill down to ProvState, and then to City. How should you configure the drill down in the bar chart?
A. In the Value field, add Country. In the Legend field, add ProvState at the top, followed by City.
B. In the Legend field, add Country. In the Axis field, add ProvState at the top, followed by City.
C. In the Axis field, add Country at the top, followed by ProvState, and then City.
D. In the Value field, add Country at the top, followed by ProvState, and then City.
Question No : 169) Note: This question is part of a series of questions that present the same scenario. Each question in the series contains a unique solution that might meet the stated goals. Some question sets might have more than one correct solution, while others might not have a
correct solution.
After you answer a question in this section, you will NOT be able to return to it. As a result, these questions will not appear in the review screen.
You are modeling data by using Microsoft Power Bl. Part of the data model is a large Microsoft SQL Server table named Order that has more than 100 million records.
During the development process, you need to import a sample of the data from the Order table.
Solution: You add a WHERE clause to the SQL statement.
Does this meet the goal?
A. Yes
B. No
Question No : 170) Note: This question is part of a series of questions that present the same scenario. Each question in the series contains a unique solution that might meet the stated goals. Some question sets might have more than one correct solution, while others might not have a correct solution.
After you answer a question in this scenario, you will NOT be able to return to it. As a result, these questions will not appear in the review screen.
You have several reports and dashboards in a workspace.
You need to grant all organizational users read access to a dashboard and several reports.
Solution: You create an Azure Active Directory group that contains all the users. You share each report and dashboard to the group.
Does this meet the goal?
A. Yes
B. No
Question No : 171) You have a Microsoft Power BI data model that contains three tables named Sales, Product, and Date.
The Sales table has an existing measure named [Total Sales] that sums the total sales from the Sales table.
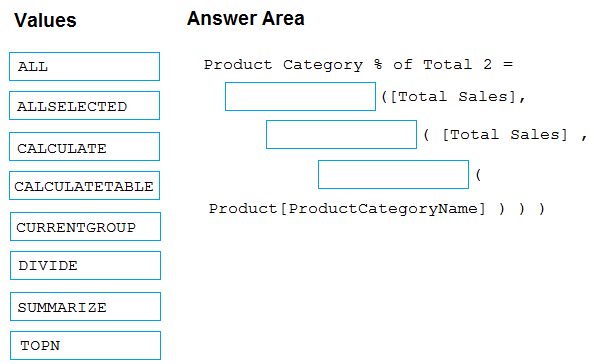
You need to write a calculation that returns the percentage of total sales that a selected ProductCategoryName value represents. The calculation must respect any slicers on ProductCategoryName and must show the percentage of visible total sales. For example, if there are four ProductCategoryName values, and a user filters one out, a table showing ProductCategoryName and the calculation must sum up to 100 percent.
How should you complete the calculation? To answer, drag the appropriate values to the correct targets. Each value may be used once, more than once, or not at all. You may need to drag the split bar between panes or scroll to view content.
NOTE: Each correct selection is worth one point.
Question No : 172) You are using existing reports to build a dashboard that will be viewed frequently in portrait mode on mobile phones.
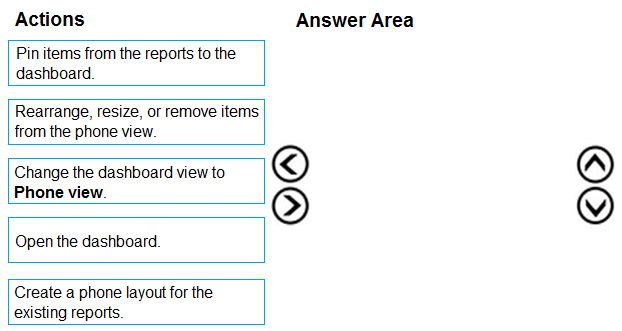
You need to build the dashboard.
Which four actions should you perform in sequence? To answer, move the appropriate actions from the list of actions to the answer area and arrange them in the correct order.
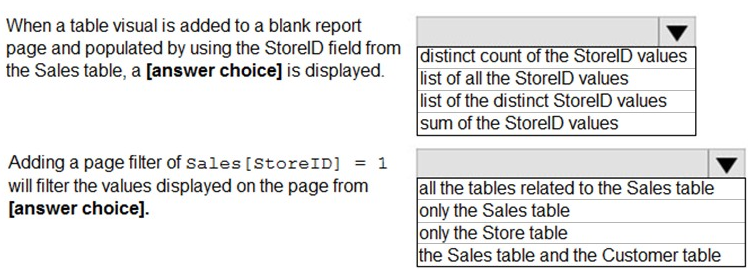
Question No : 173) You have the Power BI data model shown in the following exhibit.
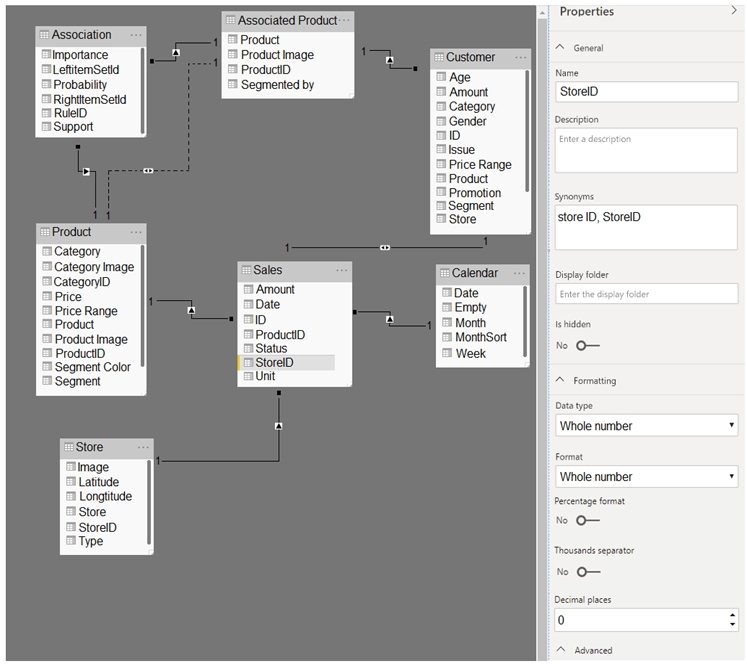
Use the drop-down menus to select the answer choice that completes each statement based on the information presented in the graphic.
NOTE: Each correct selection is worth one point.
Question No : 174) Note: This question is part of a series of questions that present the same scenario. Each question in the series contains a unique solution that might meet the stated goals. Some question sets might have more than one correct solution, while others might not have a correct solution.
After you answer a question in this scenario, you will NOT be able to return to it. As
a result, these questions will not appear in the review screen.
You have several reports and dashboards in a workspace.
You need to grant all organizational users read access to a dashboard and several reports.
Solution: You assign all the users the Viewer role to the workspace.
Does this meet the goal?
A. Yes
B. No
Question No : 175) You have multiple dashboards.
You need to ensure that when users browse the available dashboards from powerbi.com. they can see which dashboards contain Personally Identifiable Information (Pll). The solution must minimize configuration effort and impact on the dashboard design.
What should you use?
A. Active Directory groups
B. tiles
C. data classifications
D. comments
Question No : 176) You have the visual shown in the Original exhibit. {Click the Original tab.)
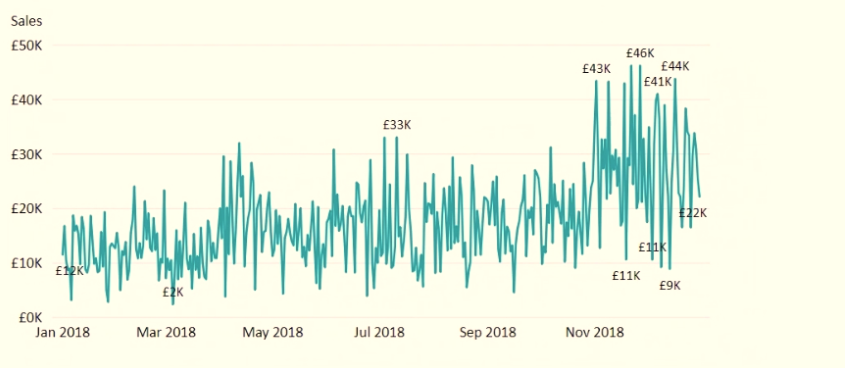
You need to configure the visual as shown in the Modified exhibit. (Click the Modified tab.)
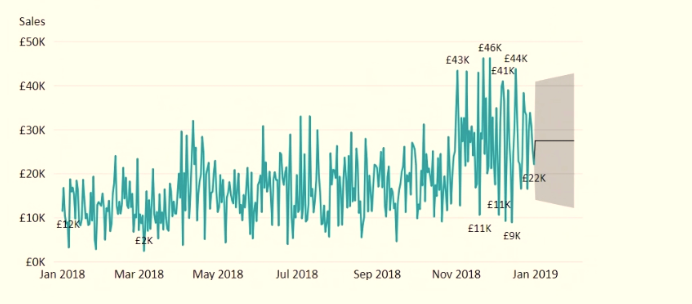
What should you add to the visual?
A. a measure
B. a trendline
C. a forecast
D. an Average line
Question No : 177) You have a collection of reports for the HR department of your company. The datasets use row-level security (RLS). The company has multiple sales regions that each has an HR manager. You need to ensure that the HR managers can interact with the data from their region only. The HR managers must be prevented from changing the layout of the reports.
How should you provision access to the reports for the HR managers?
A. Create a new workspace, copy the datasets and reports, and add the HR managers as members of the workspace.
B. Publish the reports to a different workspace other than the one hosting the datasets.
C. Publish the reports in an app and grant the HR managers access permission.
D. Add the HR managers as members of the existing workspace that hosts the reports and the datasets.
Question No : 178) You need to create the On-Time Shipping report.
The report must include a visualization that shows the percentage of late orders. Which type of visualization should you create?
A. scarterplot
B. bar chart
C. piechart
Question No : 179) You import two Microsoft Excel tables named Customer and Address into Power Query. Customer contains the following columns:
Customer ID
Customer Name
Phone
Email Address
Address ID
Address contains the following columns:
Address ID
Address Line 1
Address Line 2
City
State/Region
Country
Postal Code
The Customer ID and Address ID columns represent unique rows.
You need to create a query that has one row per customer. Each row must contain City, State/Region, and Country for each customer.
What should you do?
A. Merge the Customer and Address tables.
B. Transpose the Customer and Address tables.
C. Group the Customer and Address tables by the Address ID column.
D. Append the Customer and Address tables.
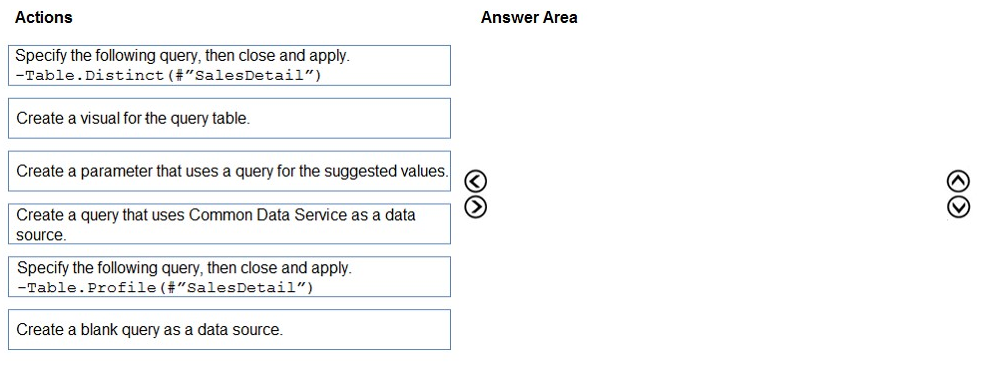
Question No : 180) You are modeling data in table named SalesDetail by using Microsoft Power Bl.
You need to provide end users with access to the summary statistics about the SalesDetail data. The users require insights on the completeness of the data and the value distributions.
Which three actions should you perform in sequence? To answer, move the appropriate actions from the list of actions to the answer area and arrange them in the correct order.
PL-300 Answers