Microsoft Power BI Data Analyst (PL-300) Free Questions - Part 7
Question No : 91) You have a Microsoft SharePoint Online site that contains several document libraries. One of the document libraries contains manufacturing reports saved as Microsoft Excel files. All the manufacturing reports have the same data structure.
You need to load only the manufacturing reports to a table for analysis.
What should you do in Microsoft Power Bl Desktop?
A. Get data from a SharePoint Online folder, enter the site URL, and then select Combine & Load.
B. Get data from a SharePoint Online list and enter the site URL. Edit the query and filter by the path to the manufacturing reports library.
C. Get data from a SharePoint Online folder and enter the site URL. Edit the query and filter by the path to the manufacturing reports library.
D. Get data from a SharePoint Online list, enter the site URL, and then select Combine & Load.
Question No : 92) You have two tables named Customers and Invoice in a Power BI model. The Customers table contains the following fields:
CustomerID
Customer City
Customer State
Customer Name
Customer Address 1
Customer Address 2
Customer Postal Code
The Invoice table contains the following fields:
Order ID
Invoice ID
Invoice Date
Customer ID
Total Amount
Total Item Count
The Customers table is related to the Invoice table through the Customer ID columns. A customer can have many invoices within one month.
The Power BI model must provide the following information:
The number of customers invoiced in each state last month
The average invoice amount per customer in each postal code
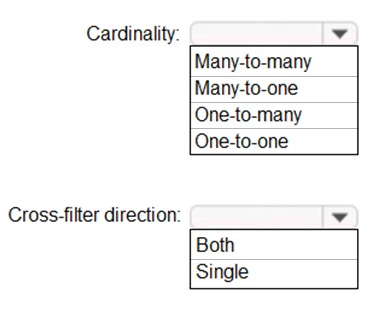
You need to define the relationship from the Customers table to the Invoice table. The solution must optimize query performance.
What should you configure? To answer, select the appropriate options in the answer area.
NOTE: Each correct selection is worth one point.
Question No : 93) You are creating an analytics report that will consume data from the tables shown in the following table.
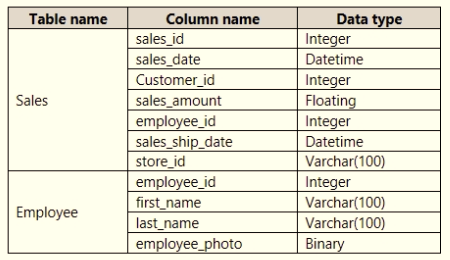
There is a relationship between the tables.
There are no reporting requirements on employeejd and employee_photo.
You need to optimize the data model
What should you configure for employeejd and employee.photo? To answer, select the appropriate options in the answer area.

Question No : 94) You have a Power BI report that uses a dataset based on an Azure Analysis Services live connection.
You need to ensure that users can use Q&A from the Power BI service for the dataset.
What should you do?
A. From the Power BI service, add an enterprise gateway to the dataset.
B. From Power BI Desktop, add synonyms and suggested questions.
C. From Power BI Desktop, add a Q&A visual to the report.
D. From the Power Bi service, select Turn on Q& A for this dataset.
Question No : 95) You have a CSV file that contains user complaints. The file contains a column named
Logged. Logged contains the date and time each compliant occurred. The data in Logged is in the following format: 2018-12-31 at 08:59.
You need to be able to analyze the complaints by the logged date and use a built-in date hierarchy.
D18912E1457D5D1DDCBD40AB3BF70D5D
What should you do?
A. Change the data type of the Logged column to Date.
B. Apply a transform to extract the last 11 characters of the Logged column and set the data type of the new column to Date.
C. Create a column by example that starts with 2018-12-31 and set the data type of the new column to Date.
D. Apply a transform to extract the first 11 characters of the Logged column.
Question No : 96) You have a power BI tenant that hosts the datasets shown in the following table.
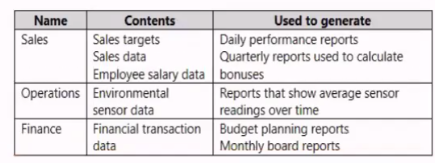
You have the following requirements:
• The export of reports that contain Personally Identifiable Information (Pll) must be prevented.
• Data used for financial decisions must be reviewed and approved before use.
For each of the following statements, select Yes if the statement is true. Otherwise select
No. NOTE: Each correct selection is worth one point

Question No : 97) In Power Bi Desktop, you are creating visualizations in a report based on an imported
dataset
You need to allow Power Bi users to export the summarized data used to create the visualizations but prevent the users from exporting the underlying data
What should you do?
A. From Power BI Desktop, configure the Data Load settings for the current file.
B. From the Power BI service, configure the dataset permissions.
C. From Power BI Desktop, configure the Report settings for the current file.
D. From Power BI Desktop, modify the data source permissions.
Question No : 98) You have a Microsoft Power Bl dashboard.
You need to ensure that consumers of the dashboard can give you feedback that will be visible to the other consumers of the dashboard.
What should you use?
A. Feedback
B. Subscribe
C. Comments
D. Mark as favorite
Question No : 99) You have the visual shown in the exhibit. (Click the Exhibit tab.)
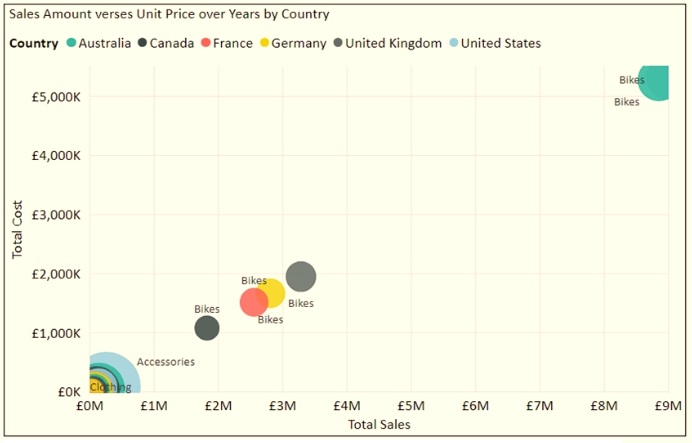
You need to show the relationship between Total Cost and Total Sales over time.
What should you do?
A. Add a play axis.
B. Add a slicer for the year.
C. From the Analytics pane, add an Average line.
D. Create a DAX measure that calculates year-over-year growth.
Question No : 100) You have a large dataset that contains more than 1 million rows. The table has a datetime column named Date.
You need to reduce the size of the data model.
What should you do?
A. Round the hour of the Date column to startOfHour.
B. Change the data type of the Date column to Text.
C. Trim the Date column.
D. Split the Date column into two columns, one that contains only the time and another that contains only the date.
Question No : 101) You are creating reports in Power BI Desktop. The model has the following tables.

There is a relationship between the tables.
You plan to publish a report to the Power BI service that displays Order_amount by Order_date by Full_name.
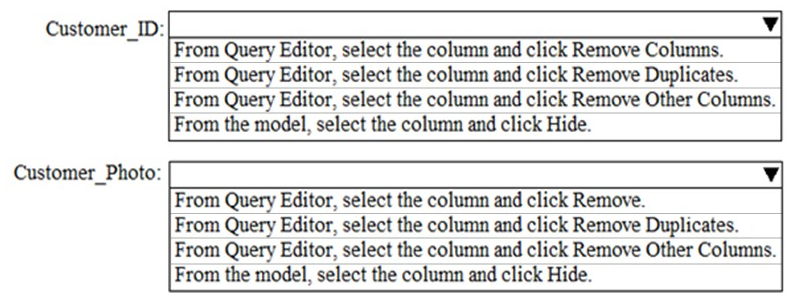
You need to ensure that only the columns required for the report appear in Report View. The solution must minimize the size of the dataset that is published.
How should you configure the columns in Power BI Desktop? To answer, select the appropriate options in the answer area.
NOTE: Each correct selection is worth one point.
Question No : 102) You are building a financial report by using Power BI.
You have a table named financials that contains a column named Date and a column named Sales.
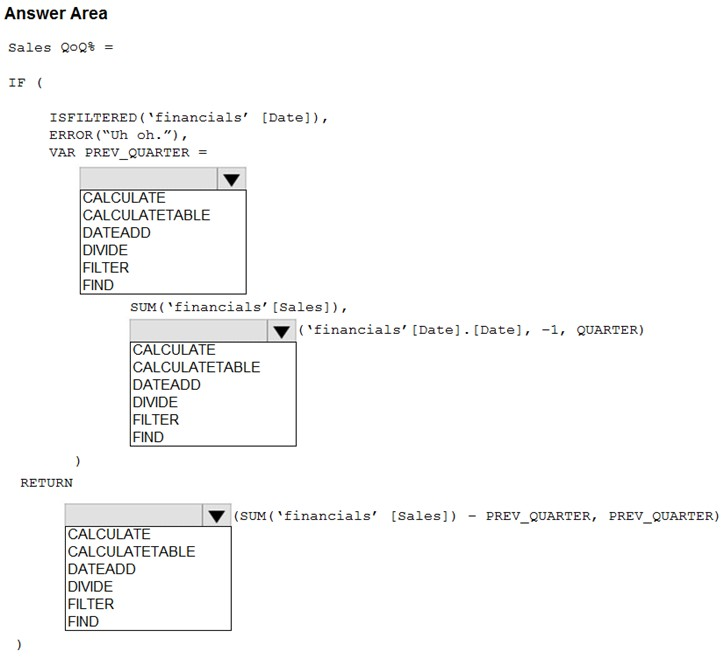
You need to create a measure that calculates the relative change in sales as compared to the previous quarter.
How should you complete the measure? To answer, select the appropriate options in the answer area.
NOTE: Each correct selection is worth one point.
Question No : 103) You manage a Power BI model has a table named Sales and product.
You need to ensure that a sales team can view only data that has a CountryRegionName value of United States and a ProductCategory value of Clothing.
What should you do from Power BI Desktop?
A. From Power BI Desktop, create a new role that has the following
filter.[countryRegionName]= “United States” && [ProductCategory]= “Clothing”
B. Add the following filters in Query Editor.CountryRegionName is United
StatesProductCategory is Clothing
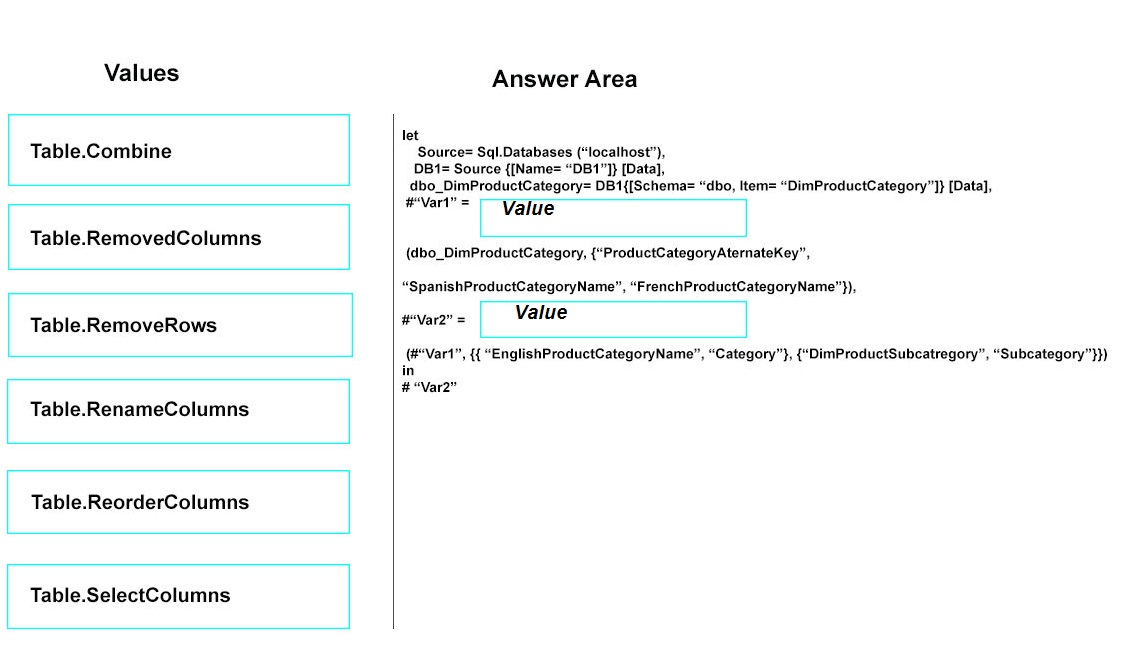
C. From Power BI Desktop, create a new role that has the following
filters.[CountryRegionName]= “United States”
D. Add the following filters to a report.CountryRegionName is United
SatesProductCategory is Clothing
Question No : 104) Note: This question is a part of a series of questions that present the same scenario. For your convenience, the scenario is repeated in each question. Each question presents a different goal and answer choices, but the text of the scenario is exactly the same in each question in this series.
Start of repeated scenario
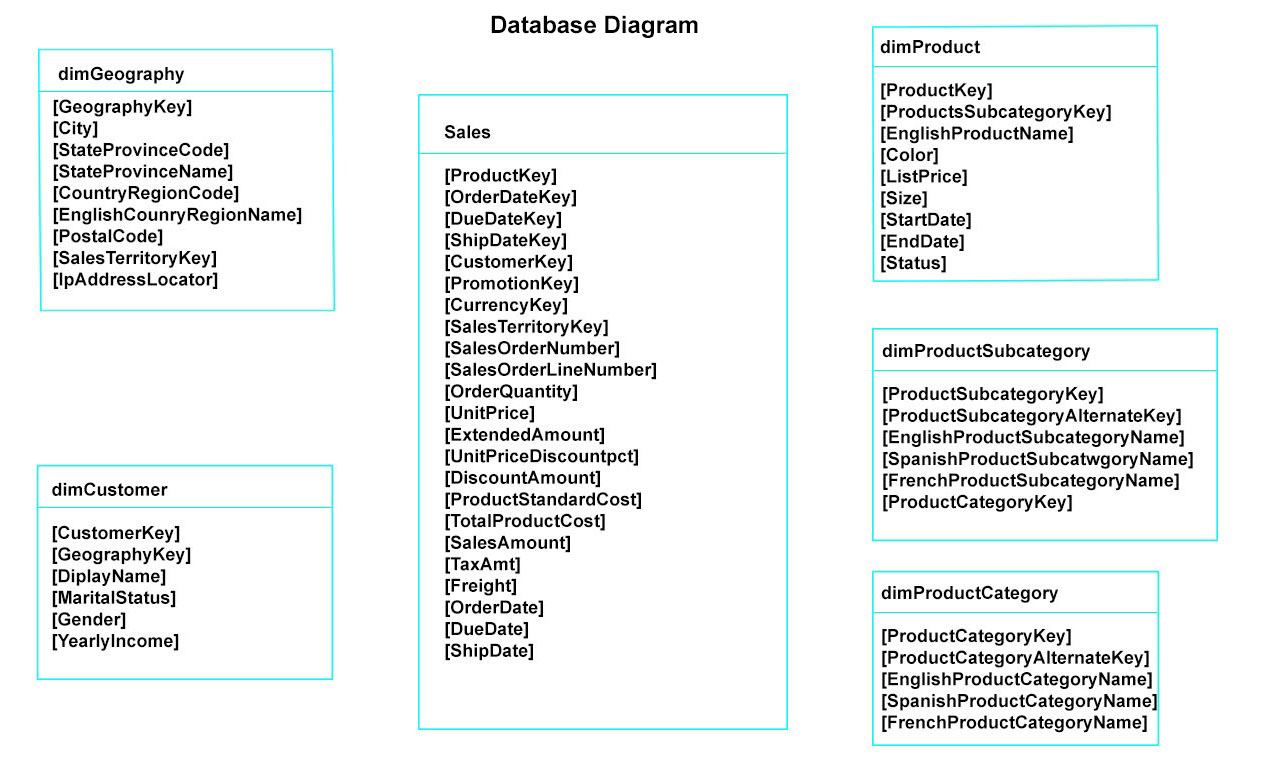
You have a Microsoft SQL Server database that has the tables shown in the Database Diagram exhibit. (Click the Exhibit.)
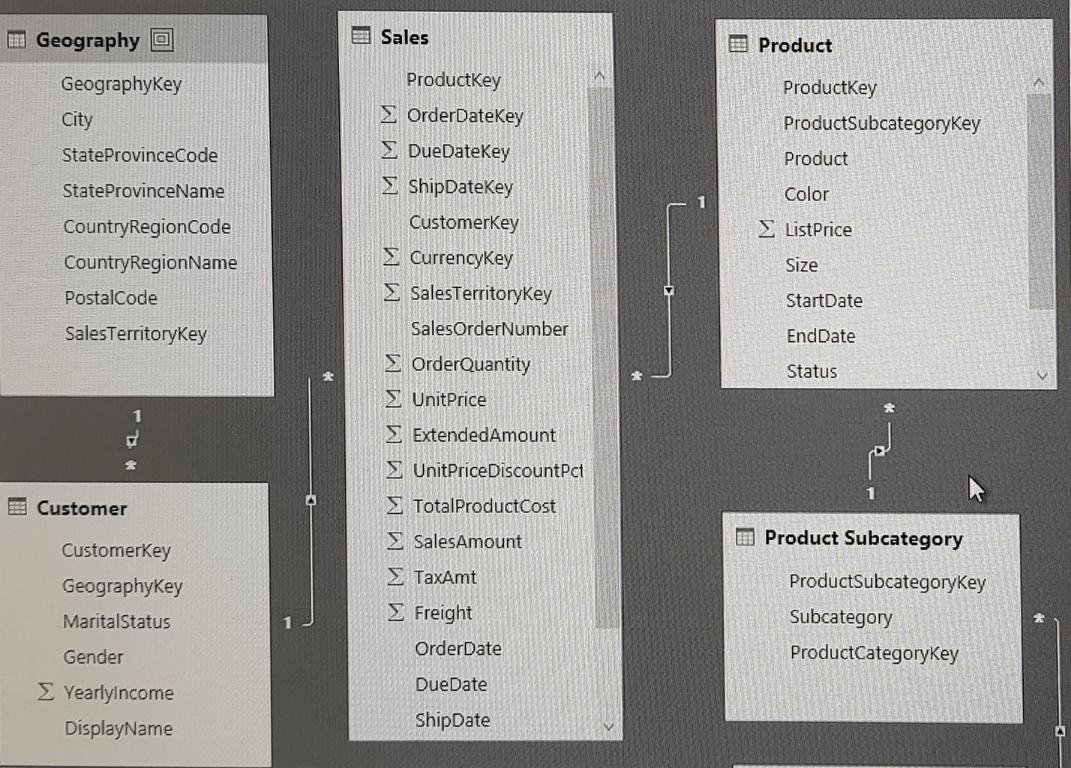
You plan to develop a Power BI model as shown in the Power BI Model exhibit. (Click the Exhibit).
You plan to use Power BI to import data from 2013 to 2015.
Product Subcategory [Subcategory] contains NULL values.
End of repeated scenario.
You implement the Power BI model.
You need to edit the Product Category table query to match the desired Power BI model.
How should you complete the advanced query? To answer, drag the appropriate values to the correct targets. Each value may be used once, more than once, or not at all.
You may need to frag the split bar between panes or scroll to view content.
NOTE: Each correct selection is worth one point.
Question No : 105) You have an Azure SQL database that contains sales transactions. The database is
updated frequently.
You need to generate reports from the data to detect fraudulent transactions. The data must be visible within five minutes of an update.
How should you configure the data connection?
A. Add a SQL statement.
B. Set Data Connectivity mode to DirectQuery.
C. Set the Command timeout in minutes setting.
D. Set Data Connectivity mode to Import.
PL-300 Answers