Microsoft Power BI Data Analyst (PL-300) Free Questions - Part 4
Question No : 46) You have a report that contains a bar chart and a column chart. The bar chart shows customer count by customer segment. The column chart shows sales by month.
You need to ensure that when a segment is selected in the bar chart, you see which portion of the total sales for the month belongs to the customer segment.
How should the visual interactions be set on the column chart when the bar chart is selected?
A. no impact
B. highlight
C. filter
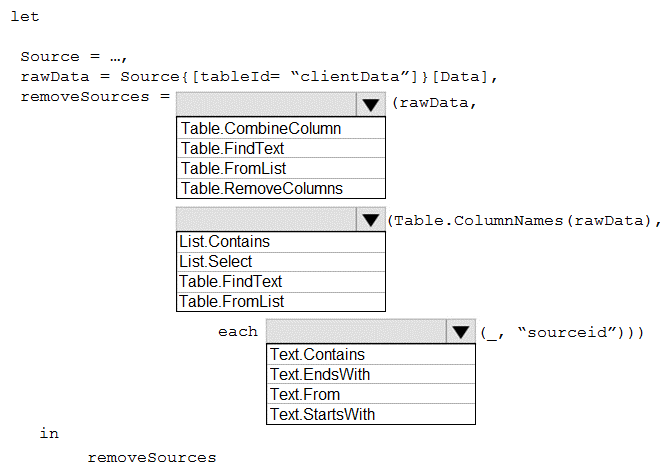
Question No : 47) You have an API that returns more than 100 columns. The following is a sample of column names.
client_notified_timestamp
client_notified_source
client_notified_sourceid
client_notified_value
client_responded_timestamp
client_responded_source
client_responded_sourceid
client_responded_value
You plan to include only a subset of the returned columns.
You need to remove any columns that have a suffix of sourceid.
How should you complete the Power Query M code? To answer, select the appropriate options in the answer area.
NOTE: Each correct selection is worth one point.
Question No : 48) Note: This question is part of a series of questions that present the same scenario. Each question in the series contains a unique solution that might meet the stated goals. Some question sets might have more than one correct solution, while others might not have a correct solution.
After you answer a question in this section, you will NOT be able to return to it. As a result, these questions will not appear in the review screen.
You create a parameter named DataSourceExcel that holds the file name and location of a Microsoft Excel data source.
You need to update the query to reference the parameter instead of multiple hard-coded copies of the location within each query definition.
Solution: You modify the source step of the queries to use DataSourceExcel as the file path.
Does this meet the goal?
A. Yes
B. No
Question No : 49) You have the following table named Location.
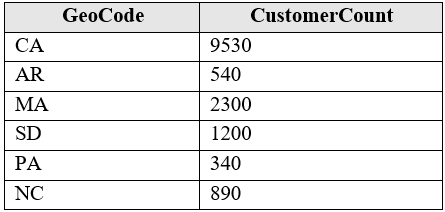
The GeoCode column represents the country where each customer is located.
You create a map visualization as shown in the exhibit. (Click the Exhibit tab.)
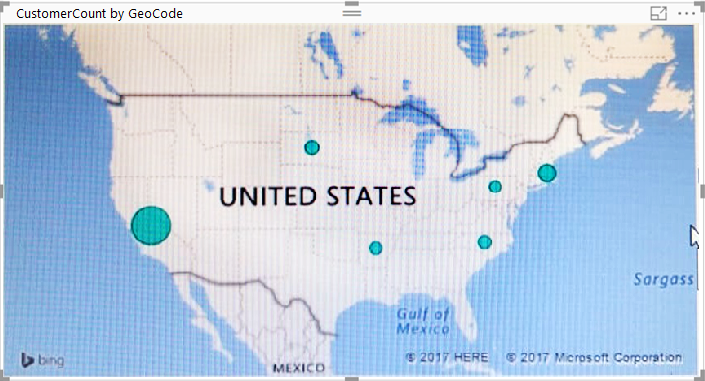
You need to ensure that the map displays the country locations.
What should you do?
A. Replace the values in the GeoCode column with postal codes or zip codes.
B. Change the name of the GeoCode column to Country.
C. Change the name of the Location table to Country.
D. Change the Default Summarization of the GeoCode column.
E. Add a Geoportal column to the Location table.
F. Change the Data Type of the GeoCode column.
Question No : 50) Note: This question is part of a series of questions that present the same scenario. Each question in the series contains a unique solution that might meet the stated goals. Some question sets might have more than one correct solution, while others might not have a correct solution.
After you answer a question in this scenario, you will NOT be able to return to it. As a result, these questions will not appear in the review screen.
You have several reports and dashboards in a workspace.
You need to grant all organizational users read access to a dashboard and several reports.
Solution: You enable included in app for all assets.
Does this meet the goal?
A. Yes
B. No
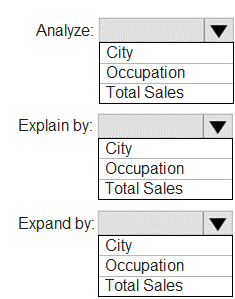
Question No : 51) You have a table that contains the following three columns:
City
Total Sales
Occupation
You need to create a key influencers visualization as shown in the exhibit. (Click the Exhibit tab.)
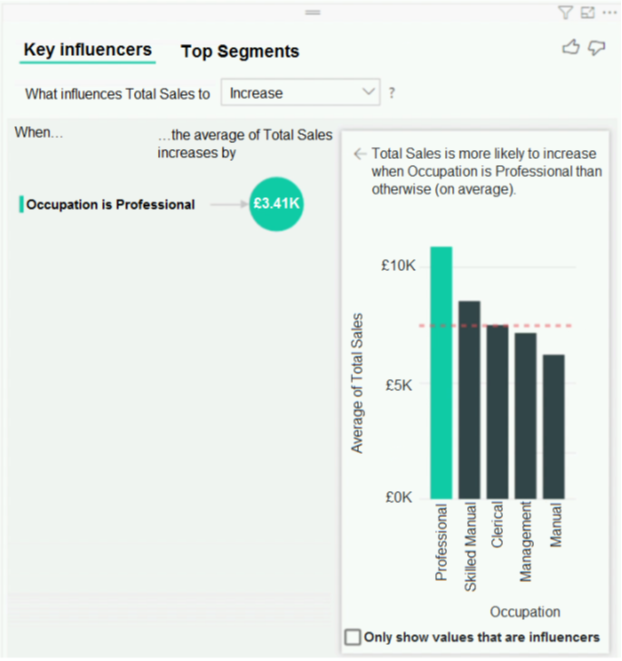
How should you configure the visualization? To answer, select the appropriate options in the answer area.
NOTE: Each correct selection is worth one point.
Question No : 52) You have a custom connector that returns ID, From, To, Subject, Body, and Has Attachments for every email sent during the past year. More than 10 million records are returned.
You build a report analyzing the internal networks of employees based on whom they send emails to.
You need to prevent report recipients from reading the analyzed emails. The solution must minimize the model size.
What should you do?
A. Implement row-level security (RLS) so that the report recipients can only see results based on the emails they sent.
B. Remove the Subject and Body columns during the import.
C. From Model view, set the Subject and Body columns to Hidden.
Question No : 53) Your company plans to completely separate development and production assets such as datasets, reports, and dashboards in Microsoft Power BI.
You need to recommend an application lifecycle strategy. The solution must minimize access to production assets and prevent end users from viewing the development assets.
What should you recommend?
A. Create production reports in a separate workspace that uses a shared dataset from the development workspace. Grant the end users access to the production workspace.
B. Create one workspace for development. From the new workspace, publish an app for production.
C. Create a workspace for development and a workspace for production. From the production workspace, publish an app.
D. In one workspace, create separate copies of the assets and append DEV to the names of the copied assets. Grant the end users access to the workspace.
Question No : 54) You have the tables shown in the following table.
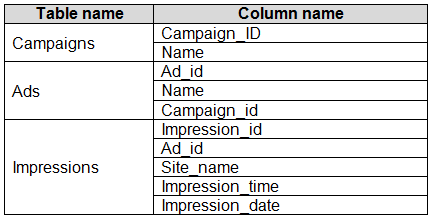
The Impressions table contains approximately 30 million records per month.
You need to create an ad analytics system to meet the following requirements:
Present ad impression counts for the day, campaign, and Site_name. The analytics for the last year are required.
Minimize the data model size.
Which two actions should you perform? Each correct answer presents part of the solution.
NOTE: Each correct selection is worth one point.
A. Group the impressions by Ad_id, Site_name, and Impression_date. Aggregate by using the CountRows function.
B. Create one-to-many relationships between the tables.
C. Create a calculated measure that aggregates by using the COUNTROWS function.
D. Create a calculated table that contains Ad_id, Site_name, and Impression_date.
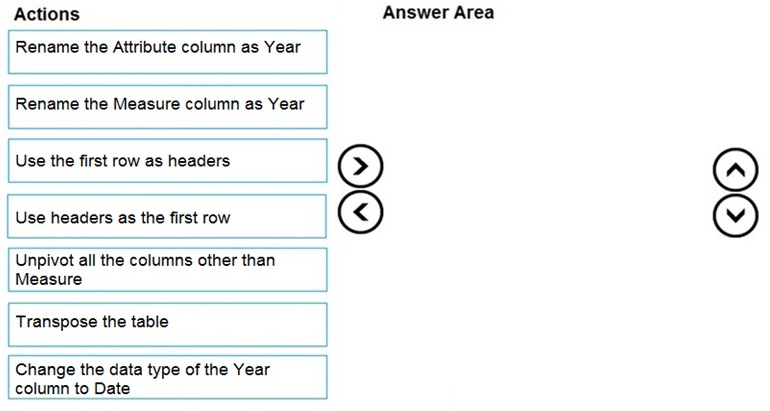
Question No : 55) You receive revenue data that must be included in Microsoft Power Bl reports. You perform an initial load of the data from a Microsoft Excel source as shown in the following exhibit.

You plan to create several visuals from the data, including a visual that shows revenue split by year and product.
You need to transform the data to ensure that you can build the visuals. The solution must ensure that the columns are named appropriately for the data that they contain.
Which three actions should you perform in sequence? To answer, move the appropriate actions from the list of actions to the answer area and arrange them in the correct order.

Question No : 56) Your company has training videos that are published to Microsoft Stream.
You need to surface the videos directly in a Microsoft Power BI dashboard.
Which type of tile should you add?
A. video
B. custom streaming data
C. text box
D. web content
Question No : 57) You are preparing a financial report in Power BI.
You connect to the data stored in a Microsoft Excel spreadsheet by using Power Query Editor as shown in the following exhibit.

You need to prepare the data to support the following:
Visualizations that include all measures in the data over time
Year-over-year calculations for all the measures
Which four actions should you perform in sequence? To answer, move the appropriate actions from the list of actions to the answer area and arrange them in the correct order.
Question No : 58) You import a large dataset to Power Query Editor.
You need to identify whether a column contains only unique values.
Which two Data Preview options can you use? Each correct answer presents a complete solution.
NOTE: Each correct selection is worth one point
A. Show whitespace
B. Column distribution
C. Column profile
D. Column quality
E. Monospaced
Question No : 59) You have the following three versions of an Azure SQL database:
Test
Production
Development
You have a dataset that uses the development database as a data source.
You need to configure the dataset so that you can easily change the data source between the development, test, and production database servers from powerbi.com.
Which should you do?
A. Create a JSON file that contains the database server names. Import the JSON file to the dataset.
B. Create a parameter and update the queries to use the parameter.
C. Create a query for each database server and hide the development tables.
D. Set the data source privacy level to Organizational and use the ReplaceValue Power Query M function.
Question No : 60) You have the dataset shown in the following exhibit.
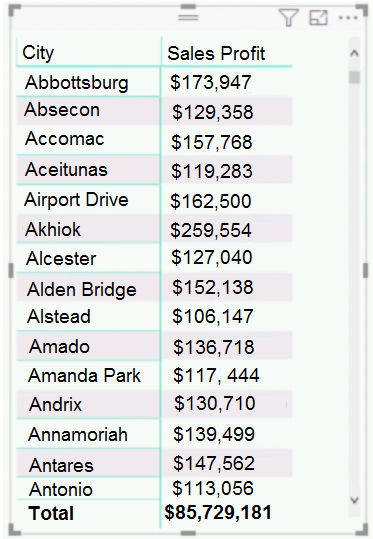
You need to ensure that the visual shows only the 10 cities that have the highest sales profit. What should you do?
PL-300 Answers