Microsoft Power BI Data Analyst (PL-300) Free Questions - Part 6
Question No : 76) Your organization has a team of power users who recently created 20 Power BI dashboards.
The power users share the dashboards with other users in the organization.
When the users attempt to access the dashboards, they receive the error message shown in the exhibit. (Click the Exhibit.)
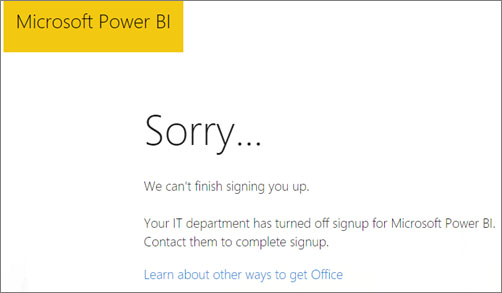
You need to ensure that all the users can access the dashboards.
What should you do first?
A. From the Microsoft Office 365 Admin center, and the Power BI (free) subscription, and then assign a license to each user.
B. From the Power BI Admin portal, modify the Privacy Settings.
C. From the properties of each dashboard, modify the Share dashboard settings.
D. Instruct each user to install Microsoft Office 2016.
Question No : 77) You view a query named Transactions as shown in the following exhibit.
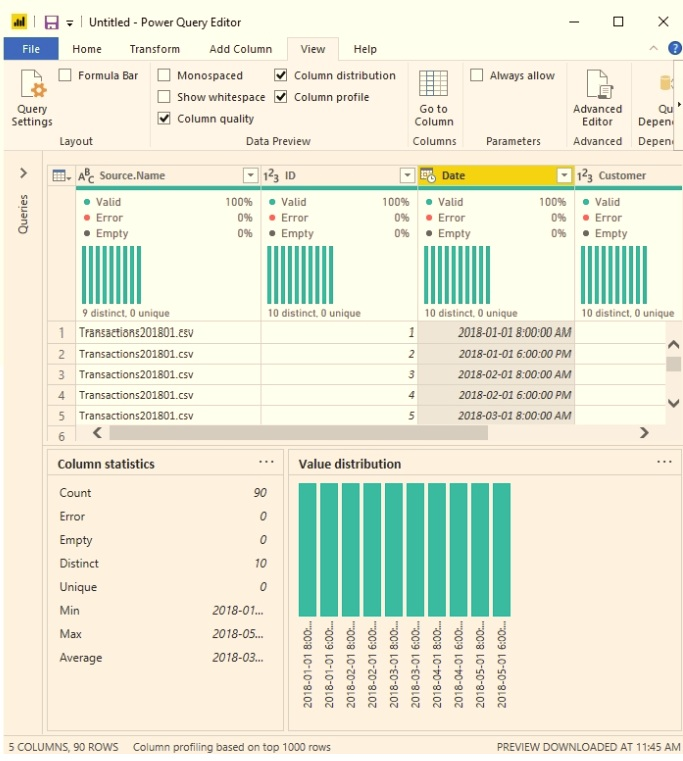
The query gets CSV files from a folder.
Use the drop-down menus to select the answer choice that completes each statement based on the information presented in the graphic.
NOTE: Each correct selection is worth one point.

Question No : 78) You plan to create a dashboard in the Power BI service that retrieves data from a Microsoft SQL Server database. The dashboard will be shared between the users in your organization.
You need to ensure that the users will see the current data when they view the dashboard.
How should you configure the connection to the data source?
A. Deploy an on-premises data gateway (personal mode). Import the data by using the Import Data Connectivity mode.
B. Deploy an on-premises data gateway. Import the data by using the Import Data Connectivity mode.
C. Deploy an on-premises data gateway. Import the data by using the DirectQuery Data Connectivity mode.
D. Deploy an on-premises data gateway (personal mode). Import the data by using the DirectQuery Data Connectivity mode.
Question No : 79) You have sales data in a star schema that contains four tables named Sales, Customer, Date, and Product. The Sales table contains purchase and ship dates.
Most often, you will use the purchase date to analyze the data, but you will analyze the data by both dates independently and together.
You need to design an imported dataset to support the analysis. The solution must minimize the model size and the number of queries against the data source.
Which data modeling design should you use?
A. Use the Auto Date/Time functionality in Microsoft Power Bl and do NOT import the Date table.
B. Duplicate the Date query in Power Query and create active relationships between Sales and both Date tables in the modeling view.
C. On the Date table, use a reference query in Power Query and create active relationships between Sales and both Date tables in the modeling view.
D. Import the Date table twice in Power Query and create active relationships between Sales and both Date tables in the modeling view.
Question No : 80) Note: This question is part of a series of questions that use the same scenario. For your convenience, the scenario is repeated in each question. Each question presents a different goal and answer choices, but the text of the scenario is the same in each question in this series.
You have a Microsoft SQL Server database that contains the following tables.
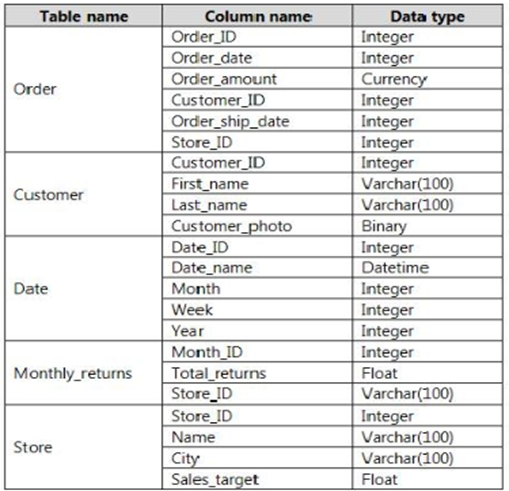
The following columns contain date information:
- Date[Month] in the mmyyyy format
- Date[Date_ID] in the ddmmyyyy format
- Date[Date_name] in the mm/dd/yyyy format
- Monthly_returns[Month_ID] in the mmyyyy format
The Order table contains more than one million rows.
The Store table has a relationship to the Monthly_returns table on the Store_ID column. This is the only relationship between the tables.
You plan to use Power BI Desktop to create an analytics solution for the data.
You need to create a relationship between the Monthly_returns table and Date[Date_ID].
What should you do before you create the relationship?
A. In the Date table, create a new calculated column named MonthJD that uses the yyyydd format.
B. In the Monthly_returns table, create a new calculated column named DateJD that uses the ddmmyyyy format.
C. To the Order table, add a calculated column that uses the RELATED(Monthly_returns[Month_ID]) DAX formula.
D. To the Date table, add a calculated column that uses the RE LATE D(Monthly_ret urns [MonthJD]) DAX formula.
Question No : 81) You have a Power BI model that has the following tables:
Product (Product_id, Product_Name)
Sales (Order_id, Order_Date, Product_id, Salesperson_id, Sales_Amount)
Salesperson (Salesperson_id, Salesperson_name, address)
You plan to create the following measure.
Measure1 = DISTINCTCOUNT(Sales[ProductID])
You need to create the following relationships:
Sales to Product
Sales to Salesperson
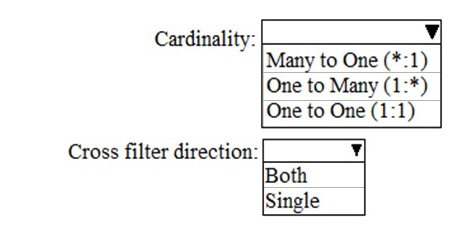
The solution must ensure that you can use Measure1 to display the count of products sold by each salesperson.
How should you configure the relationships? To answer, select the appropriate options in the answer area.
NOTE: Each correct selection is worth one point.
Question No : 82) You have a folder of monthly transaction extracts.
You plan to create a report to analyze the transaction data.
You receive the following email message: "Hi. I've put 24 files of monthly transaction data onto the shared drive. File Transactions201901.csv through Transactions201912.csv have the latest set of columns, but files Transactions201801.csv to Transactions201812.csv have an older layout without the extra fields needed for analysis. Each file contains 10 to 50 transactions."
You get data from the folder and select Combine & Load. The Combine Files dialog box is shown in the exhibit. (Click the Exhibit tab.)
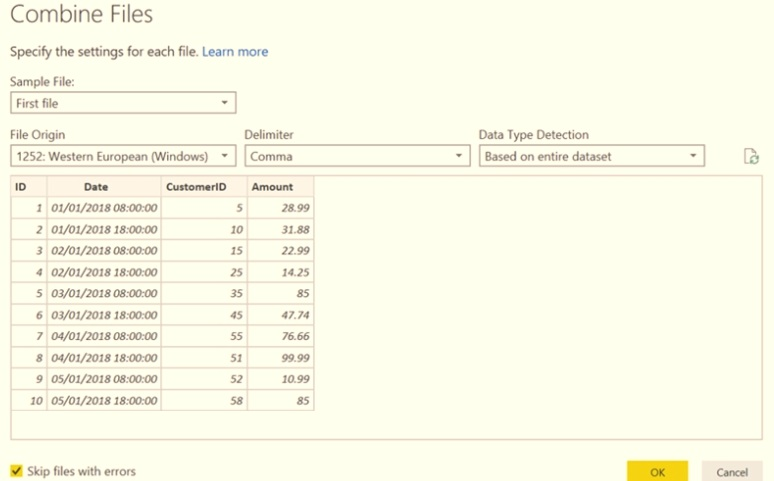
For each of the following statements, select Yes if the statement is true. Otherwise, select No.
NOTE: Each correct selection is worth one point.

Question No : 83) You are reviewing a query that produces 10,000 rows in the Power Query Editor.
You need to identify whether a column contains only unique values.
Which two Data Preview options can you use? Each correct answer presents a complete solution.
NOTE: Each correct selection is worth one point.
A. Column profile
B. Column distribution
C. Show whitespace
D. Column quality
E. Monospace
Question No : 84) Note: This question is part of a series of questions that present the same scenario. Each question in the series contains a unique solution that might meet the stated goals. Some question sets might have more than one correct solution, while others might not have a correct solution.
After you answer a question in this section, you will NOT be able to return to it. As a result, these questions will not appear in the review screen, You create a parameter named DataSourceExcel that holds the file name and location of a Microsoft Excel data source.
You need to update the query to reference the parameter instead of multiple hard-coded copies of the location within each query definition.
Solution: In the Power Query M code, you replace references to the Excel file with DataSourceExcel.
Does this meet the goal?
A. Yes
B. No
Question No : 85) You embed a Power BI report in a Microsoft SharePoint Online page.
A user name User1 can access the SharePoint Online page, but the Power BI web part displays the following error message: ?This content isn?t available?.
User1 is unable to view the report.
You verify that you can access the SharePoint Online page and that the Power BI report displays as expected.
You need to ensure that User1 can view the report form SharePoint Online.
What should you do?
A. Publish the app workspace.
B. Edit the settings of the Power BI web part.
C. Modify the members of the app workplace.
D. Share the dashboards in the app workspace.
Question No : 86) You have a report in Power BI Desktop as shown in the following exhibit.
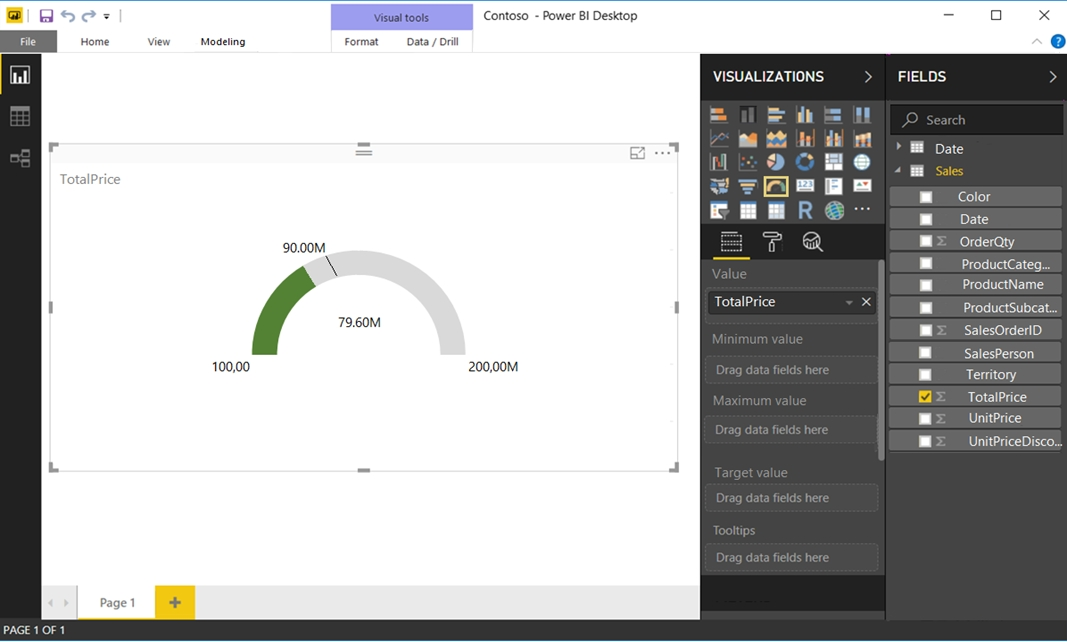
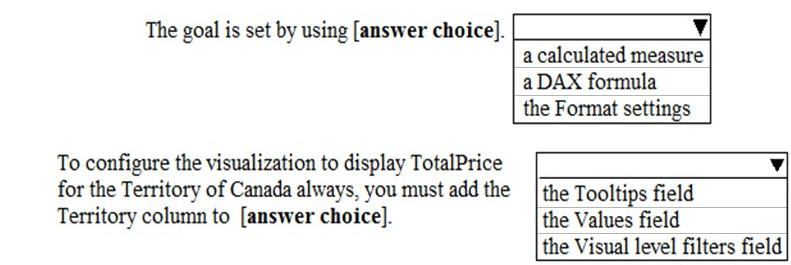
Use the drop-down menus to select the answer choice that completes each statement based on the information presented in the graphic.
Note: Each correct selection is worth one point.
Question No : 87) You have a report page that contains the visuals shown in the following exhibit.
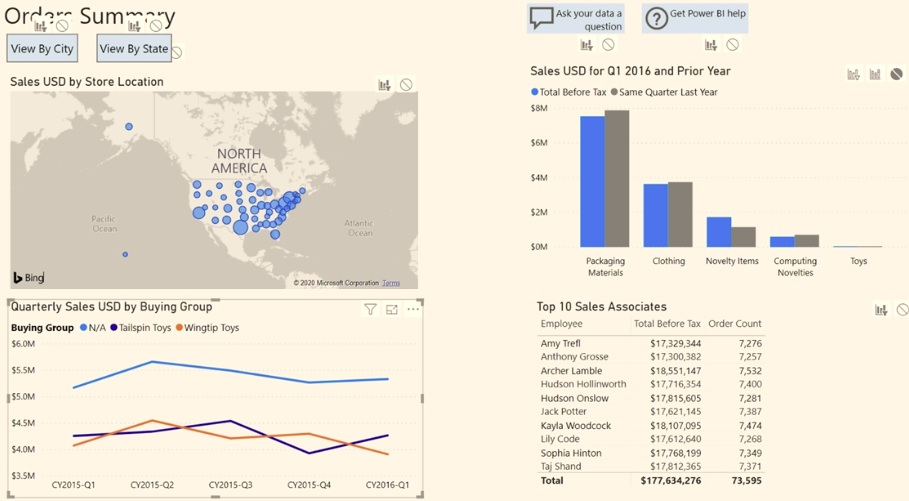
Use the drop-down menus to select the answer choice that completes each statement based on the information presented in the graphic. NOTE: Each correct selection is worth one point.

Question No : 88) You have a Microsoft Excel workbook that contains two tables.
From Power BI, you create a dashboard that displays data from the tables.
You update the tables each day.
You need to ensure that the virtualizations in the dashboard are updated daily.
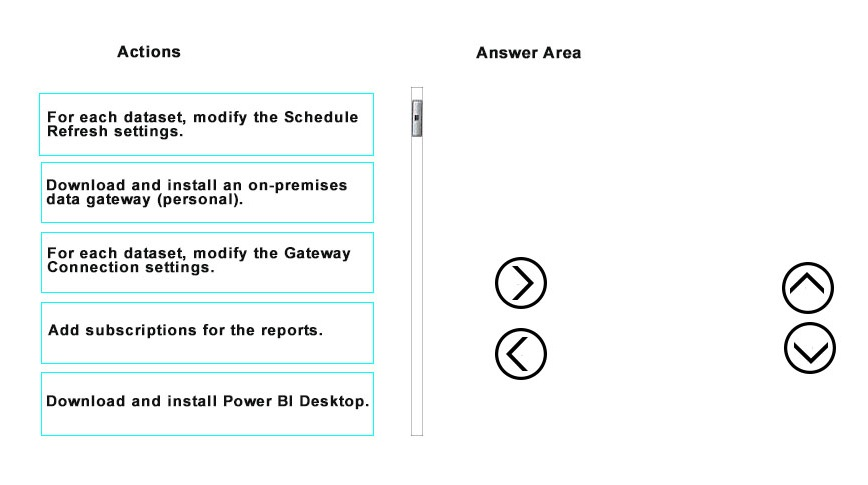
Which three actions should you perform in sequence? To answer, move the appropriate actions from the list of actions to answer area and arrange them in the correct order.
Question No : 89) You are profiling data by using Power Query Editor.
The AddressLine2 column in a table named Address is shown in the following exhibit.
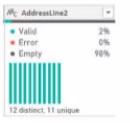
Use the drop-down menus to select the answer choice that completes each statement based on the information presented in the graphic.
NOTE: Each correct selection is worth one point.

Question No : 90) You have a collection of reports for the HR department of your company.
You need to create a visualization for the HR department that shows a historic employee counts and predicts trends during the next six months.
Which type of visualization should you use?
A. scatter chart
B. ribbon chart
C. line chart
D. key influences
PL-300 Answers